How to Use FaceIt GUI
Open data to process
To analyze mouse face motion data, navigate to the File tab in the menu bar and select the option to open an image series Folder (Ctrl + N) or a video file (Ctrl + V). Once selected, the images or video frames will be displayed in the GUI for analysis.
Analyse Pupil
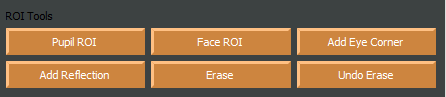
To begin pupil tracking, use the Pupil ROI button in the ROI tools section to define the eyeball region. You can adjust the position of the Pupil ROI by dragging it or resize it by clicking and dragging the blue square at its corner.
Pupil_roi_chosen After selecting and adjusting the Eyeball ROI, you can use the Eraser option to remove pixels from the surrounding eye region. This ensures that these pixels are excluded from further analysis. The size of the eraser can be customized in the settings window.
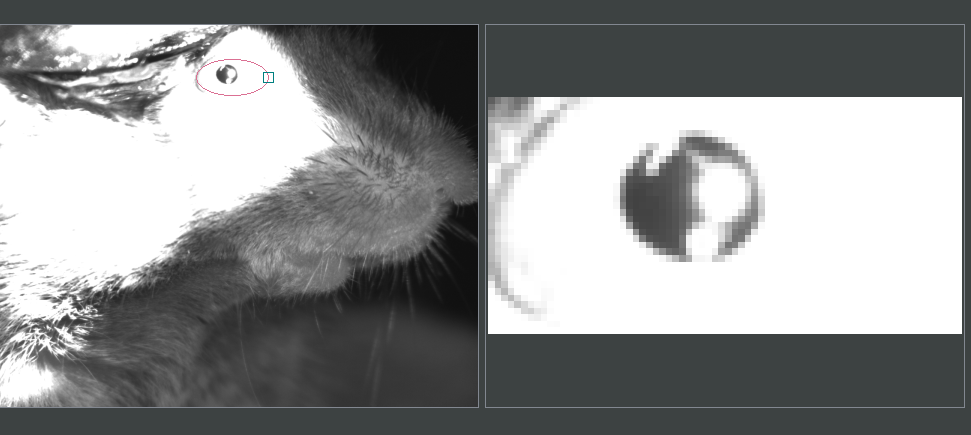
Example of eyeball chosen ROI.
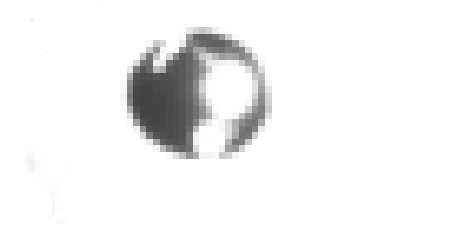
Erasing pixels from the surrounding eye region.
Important
Avoid using the Eraser on the interior of the eyeball.
If the recorded video contains light reflections in the pupil area, use the Add Reflection button to mask the reflective section. The size and position of the Reflection ellipse can be adjusted as needed.
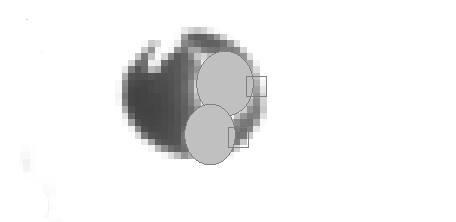
Adding reflection cover to the pupil.
Use the Saturation Slider to adjust the eyeball’s saturation and achieve the optimal contrast between the pupil and the eyeball. After completing the previous steps, use the frame slider to review the quality of pupil detection throughout your data and make any necessary adjustments. Once satisfied, select the Pupil checkbox and click Process to begin the analysis. Once the analysis is complete, a pupil area plot will appear on the GUI. You can utilize the blinking detection button to detect and remove blinking, after which a new plot, excluding blinking, will be displayed on the GUI.
Analyse whisker pad
To analyse Whisker pad motion energy you can start by defining your region of interest using Face ROI bottom in the ROI tools section. check whisker pad checkbox and click on the process bottom. After the analysis is complete, a whisker pad motion energy plot will be displayed on the GUI. If grooming activity is present in your data, you can easily interpolate the grooming segments by setting a threshold on the y-axis of the motion energy plot. To do this, click on Define Grooming Threshold and select the area where you want to remove activity above the specified level. A new plot, with the grooming segments interpolated, will then be displayed.
Saving data
When you click the save button, the processing results will automatically be stored in .npz files. To save the data in .nwb format, ensure you select the Save NWB checkbox before saving.